Ora Overview
Profile
Track your developer journey on your Profile, with your PNL, launches, win rate and positions.
Statistics
Section titled “Statistics”The Stats tab of your Profile tracks your developer journey: your overall performance across every launch, with the numbers that show your strengths and weaknesses.
Open it with Profile in the top navigation. Opening Ora while you're logged in also takes you straight to it. The Leaderboard tab next to it is covered in Leaderboard.
Profile card
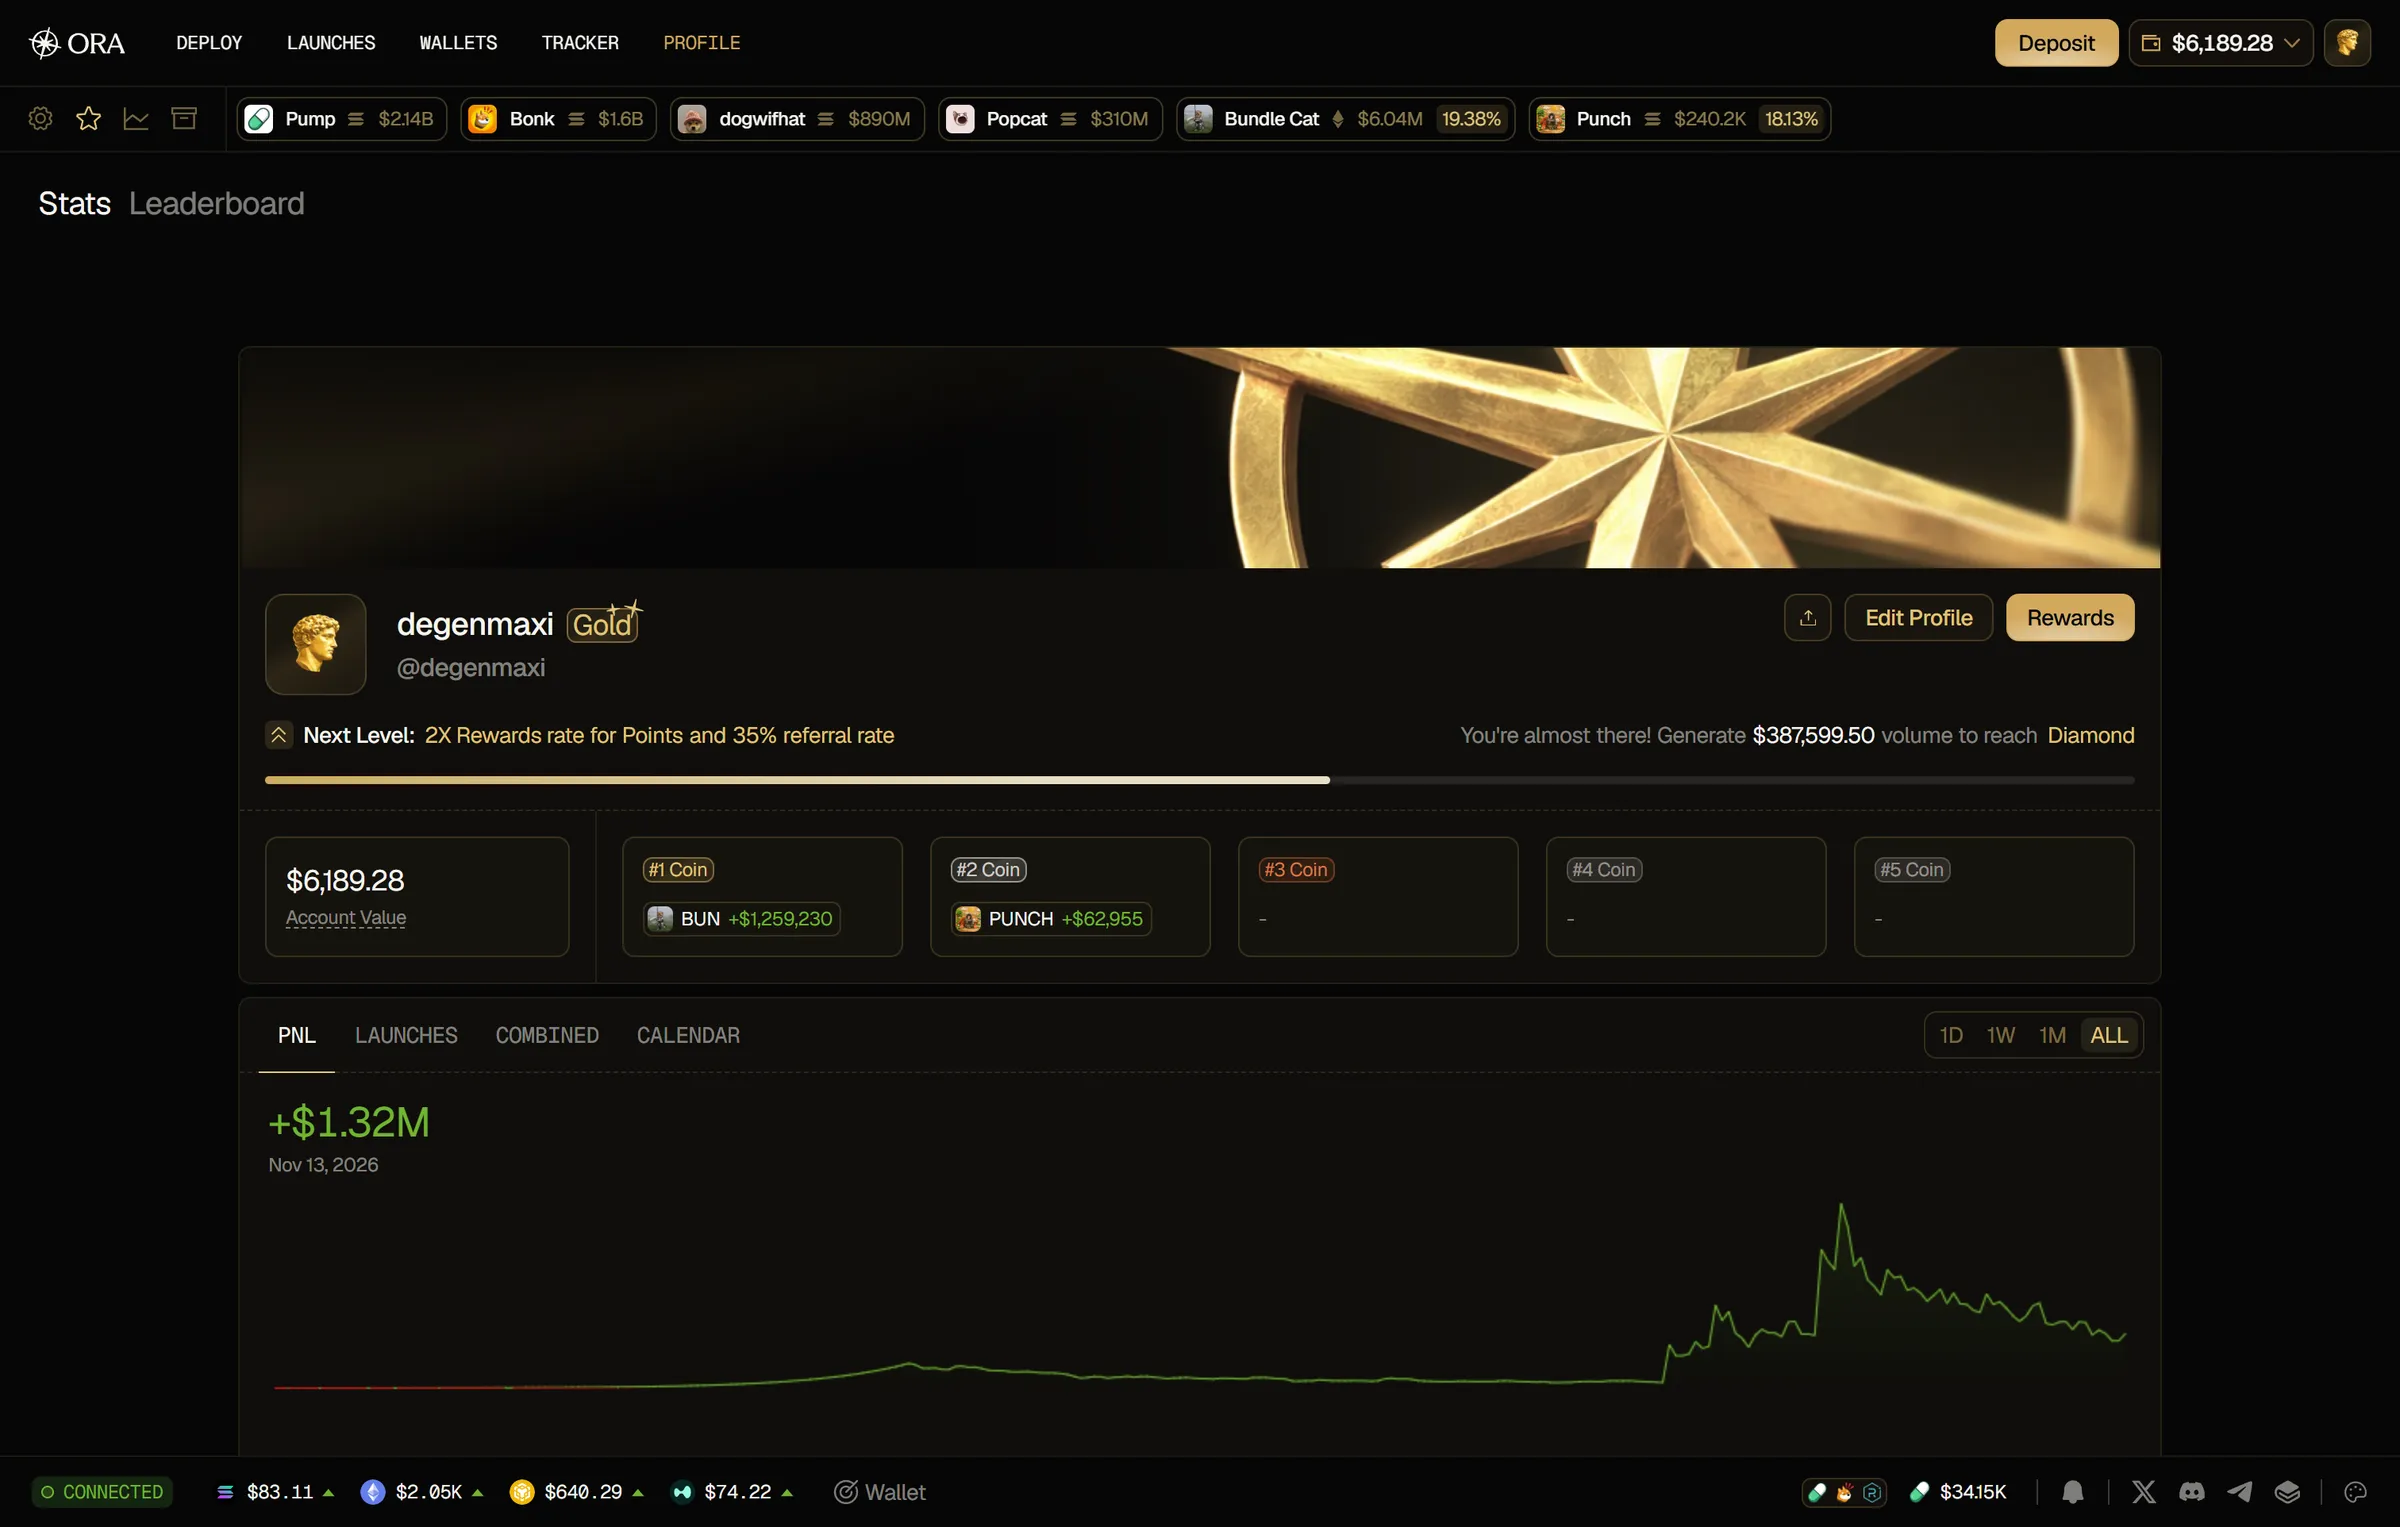
Section titled “Profile card”At the top of the tab, your profile card shows your picture, your name, your username and your rank badge. On its right:
- the Share PNL icon creates a PNL card for your whole account;
- Edit Profile changes your picture, your banner, your username and your display name;
- Rewards opens your rewards.
Under your name, Next Level shows what the next rank brings and the volume left to reach it. Below it:
- Account Value: your USDC balance, plus the few cents of SOL and ETH your wallets keep to pay network fees.
- #1 Coin to #5 Coin: your five best tokens by PNL, including the ones you've sold. Click one to open its page.
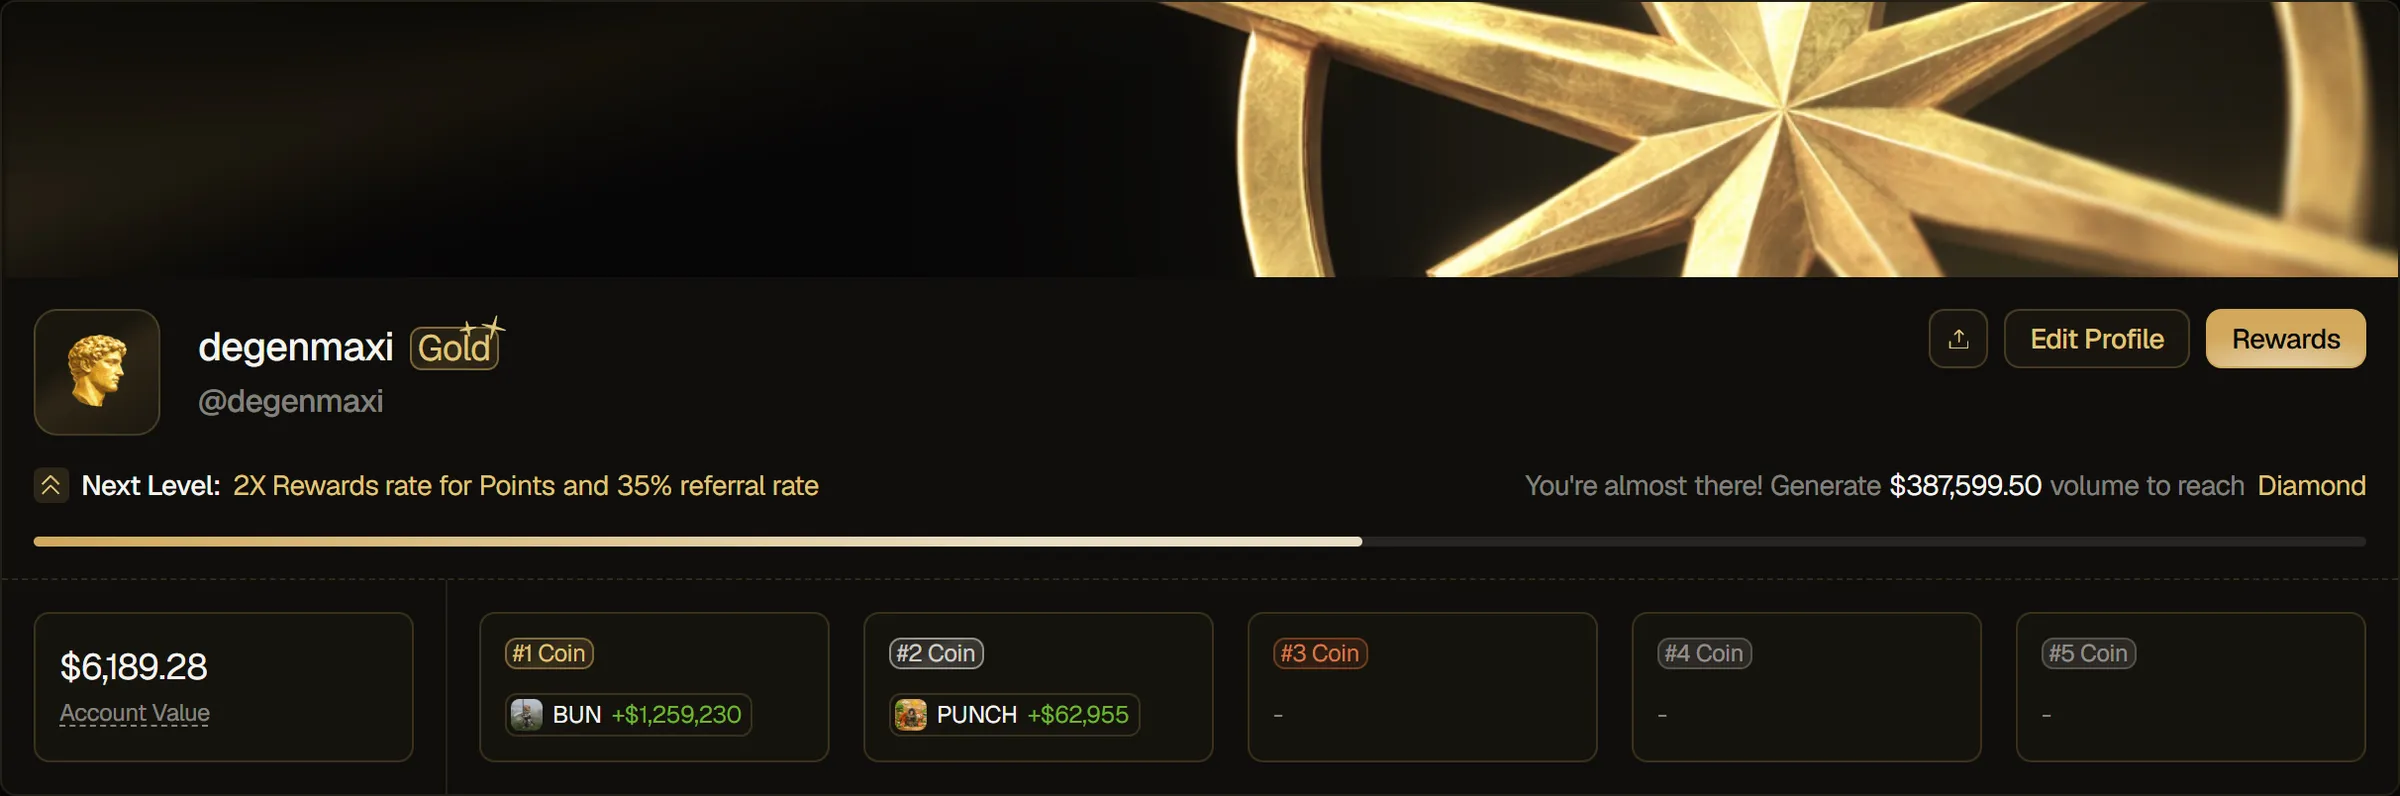
The PNL tab charts your PNL in dollars over time, so you see exactly when you performed best. Above the chart, pick a timeframe: 1D, 1W, 1M or ALL. 1W is selected by default. Hover the chart to see your PNL at a given time.
Launches
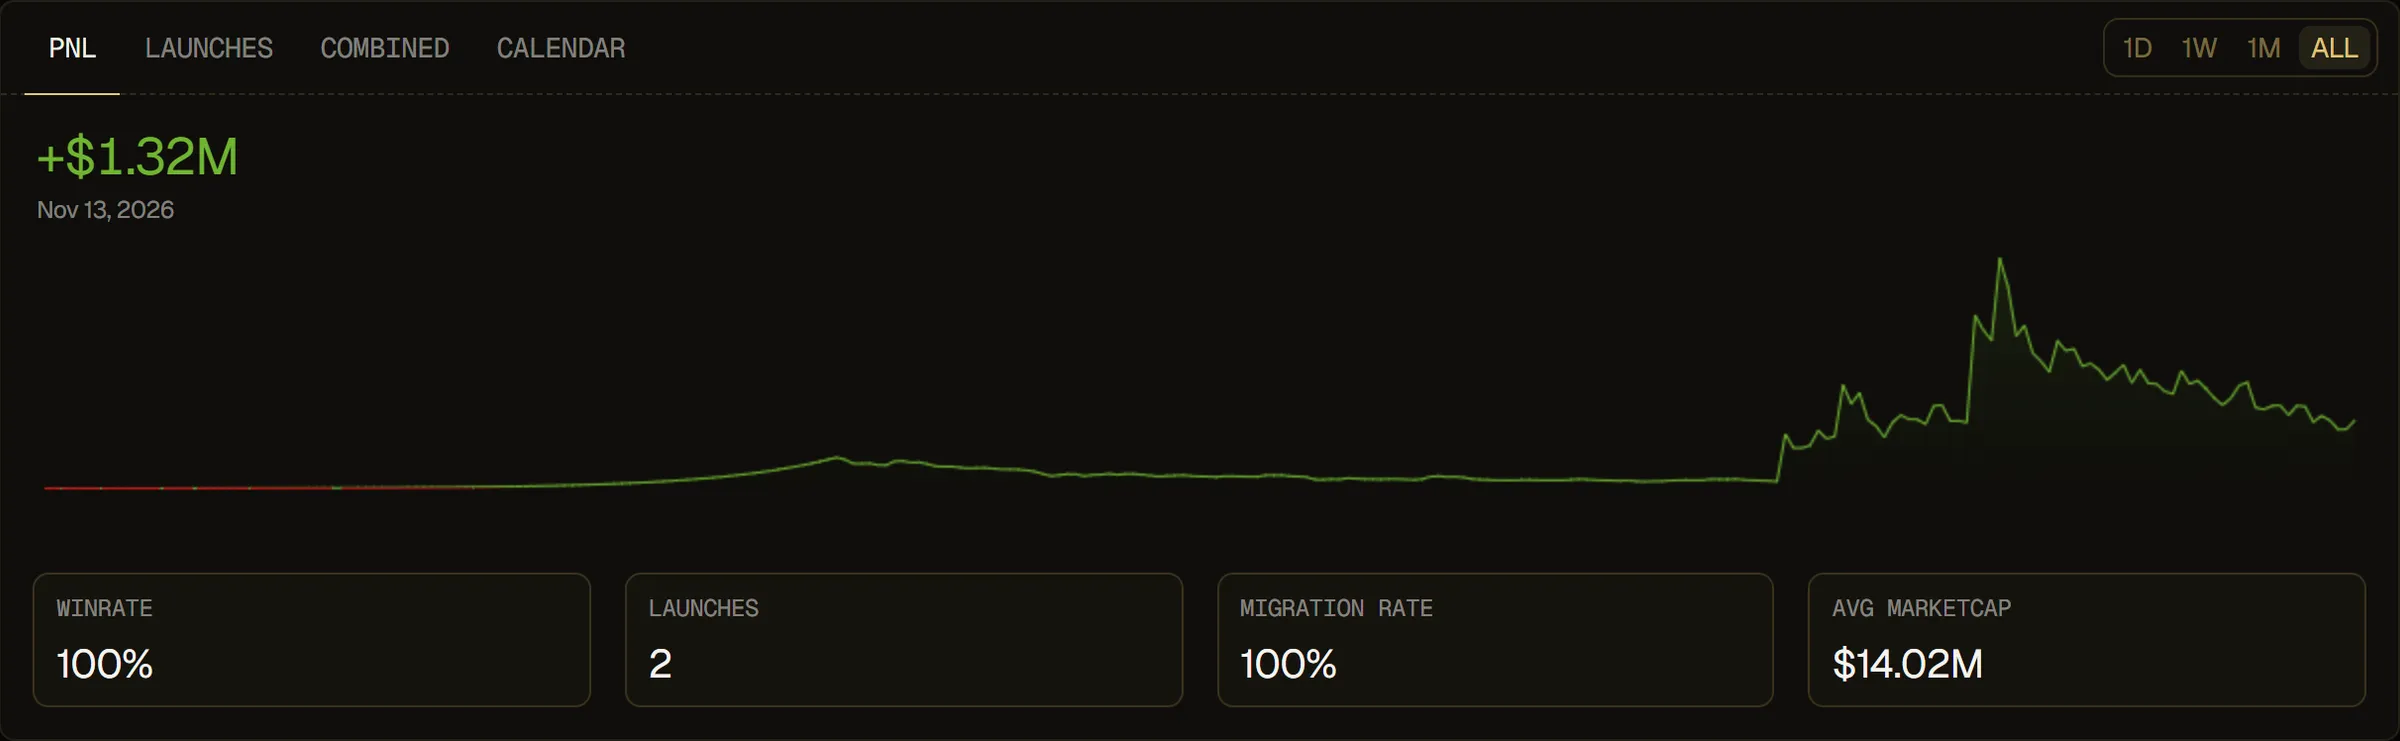
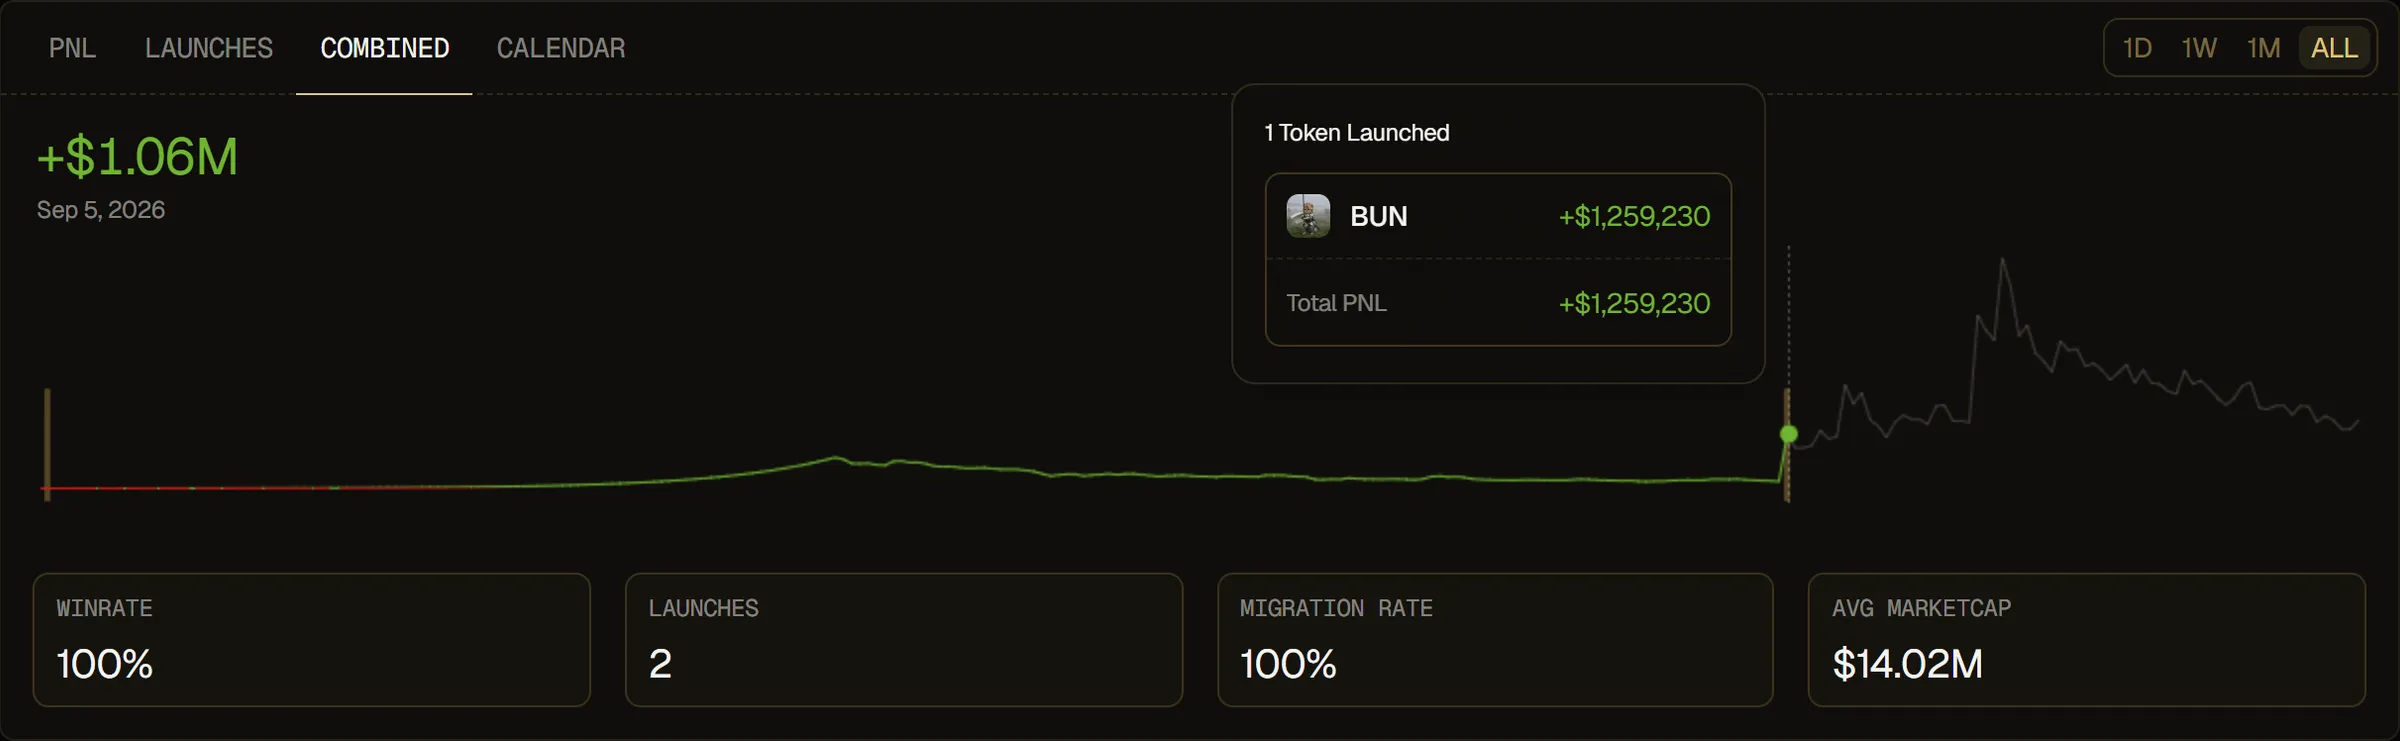
Section titled “Launches”The LAUNCHES tab shows how many tokens you launched over time, as bars, with the same timeframes as the PNL chart. Hover a bar to see the tokens you launched in that period and the PNL of each one. The COMBINED tab shows both on one chart: your PNL curve over your launch bars.
Performance
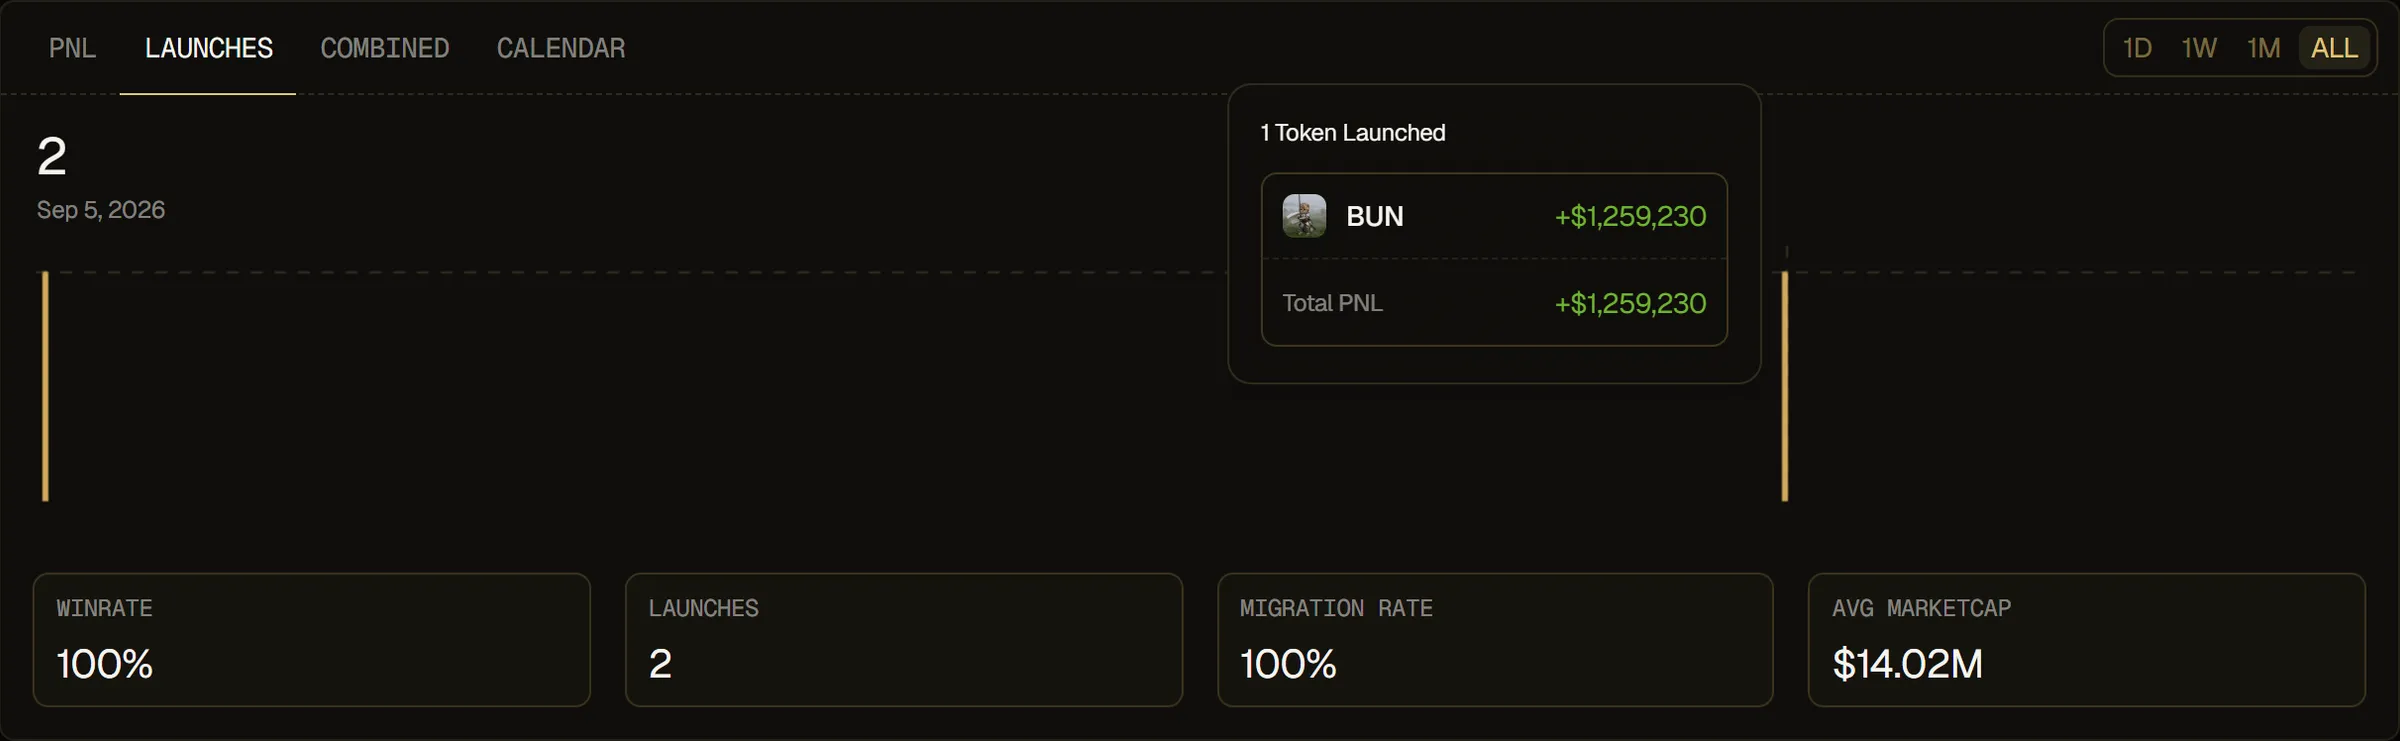
Section titled “Performance”Under the PNL, LAUNCHES and COMBINED charts, four cards sum up your launches over the timeframe you picked:
- WINRATE: your win rate on these launches.
- LAUNCHES: the number of tokens you launched.
- MIGRATION RATE: the share of your launches that migrated.
- AVG MARKETCAP: the average peak market cap of your launches.
When there's a previous period to compare with, each card also shows its change, in green or in red. Without a launch in the timeframe, the cards show a dash.

Calendar
Section titled “Calendar”The CALENDAR tab shows your daily PNL as a grid of days, as many recent weeks as fit on your screen. Green days are in profit and red days in loss: the stronger the color, the bigger the result. Hover a day to see its date, its PNL and the tokens behind it. Days without activity show No activity.
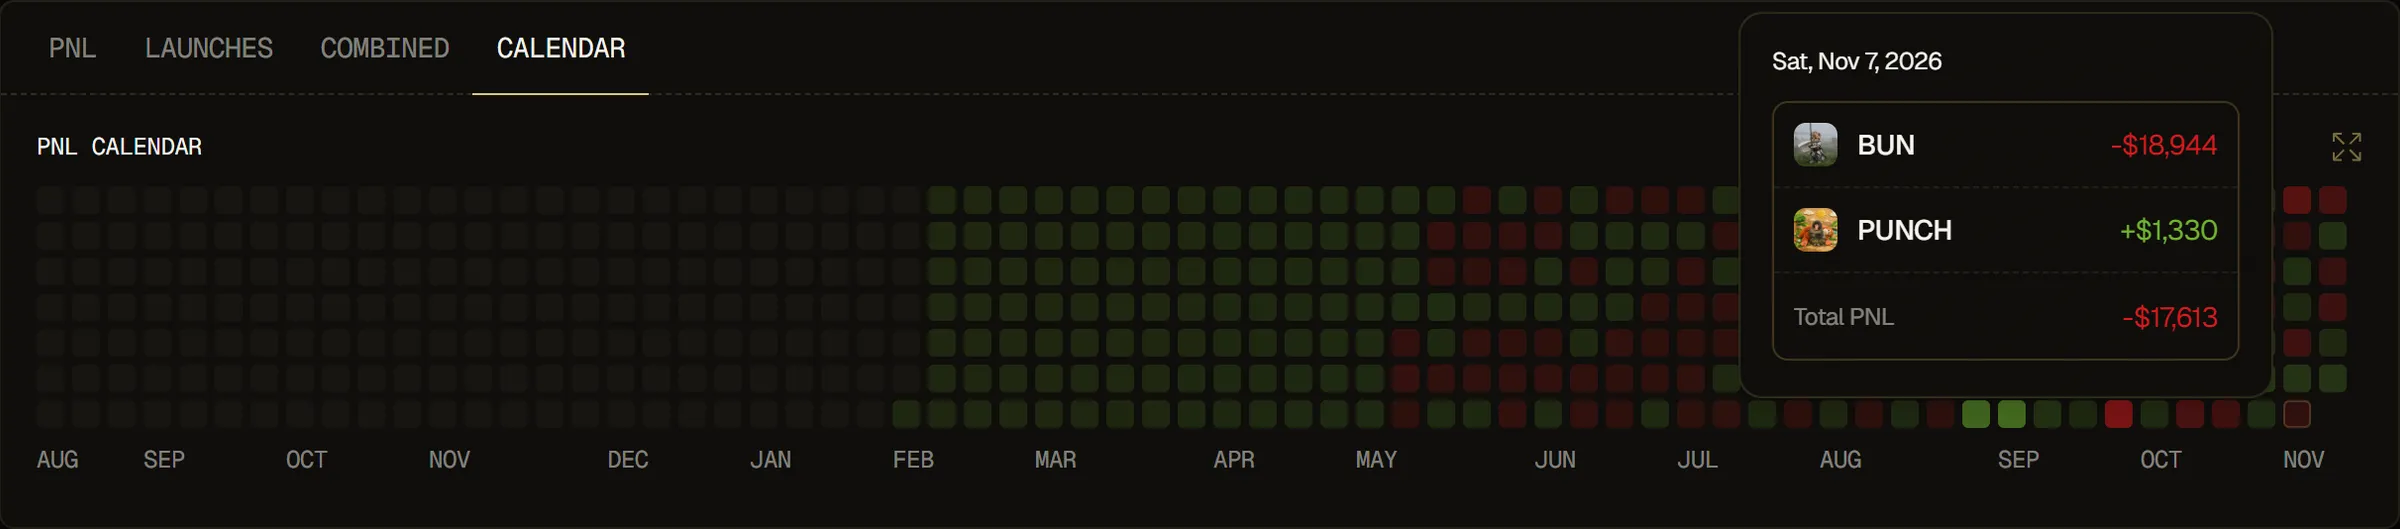
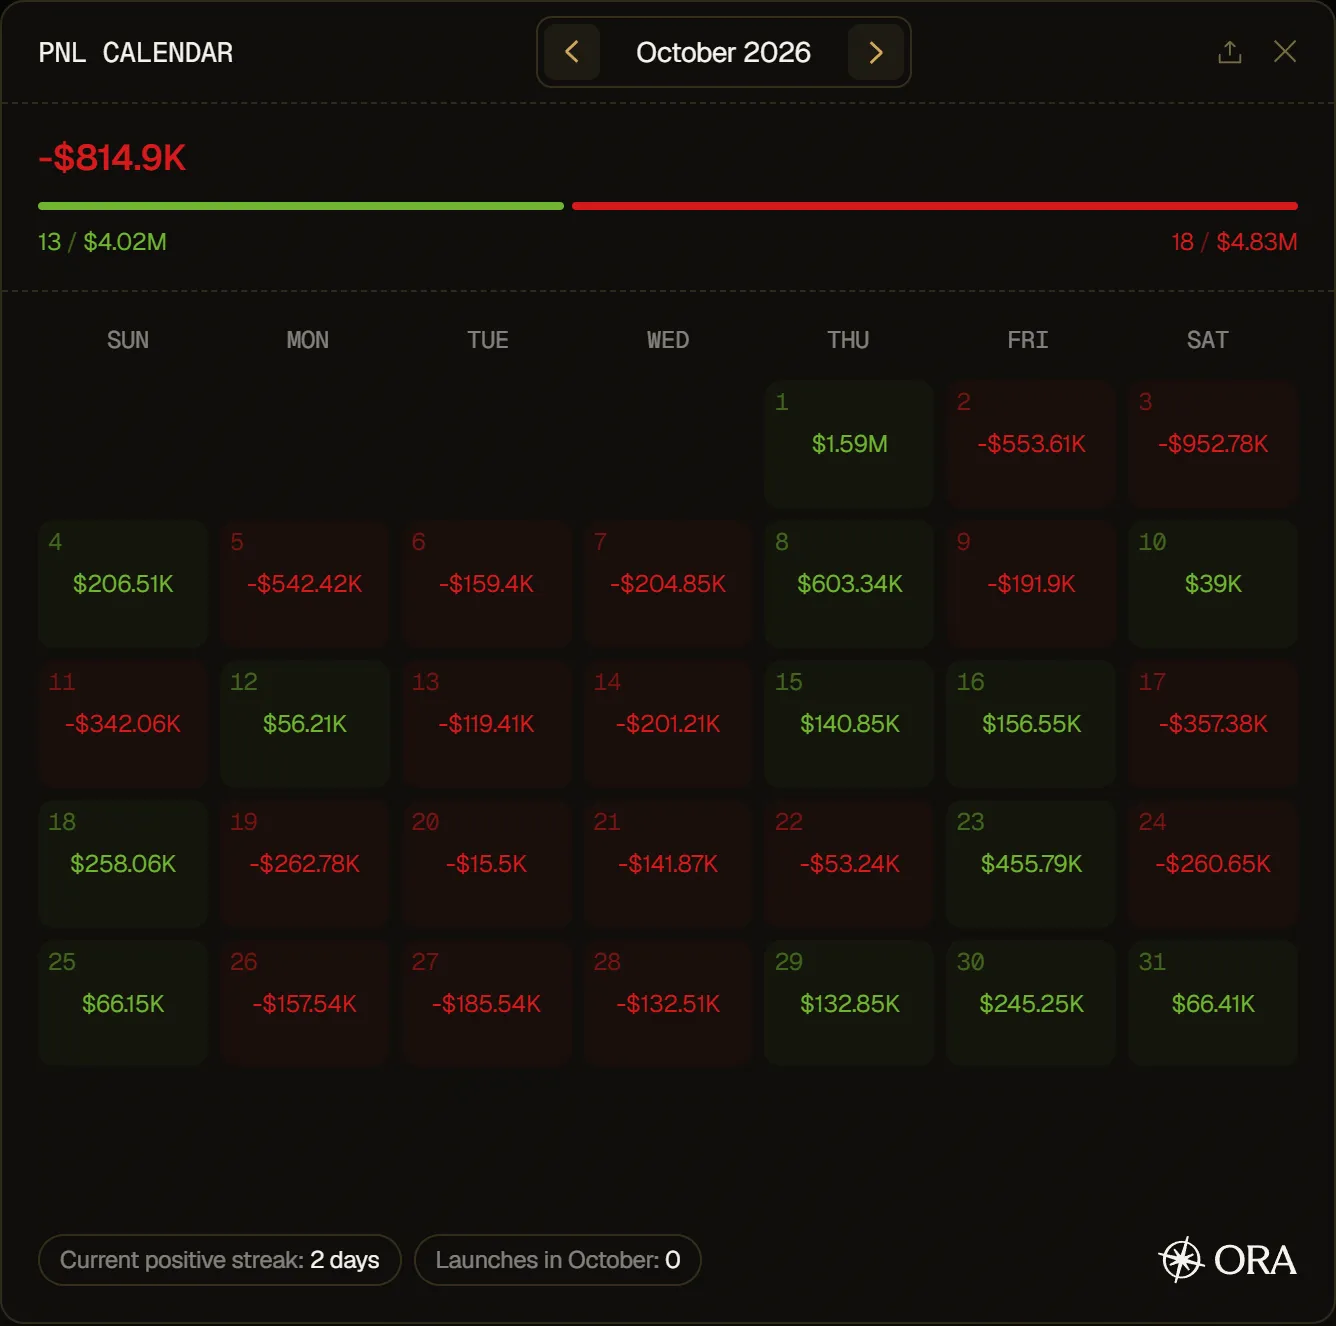
To see one month in detail, click the expand icon (Expand) in the top-right corner. The PNL Calendar window shows:
- the month's total PNL;
- your number of days in profit and in loss, with their totals;
- each day's PNL, with the number of tokens you launched that day;
- Current positive streak, your current run of days in profit, and the number of launches of the month.
Use the arrows to change month. Click the Share PNL icon to create a PNL card for the month.
Positions
Section titled “Positions”Under the chart, POSITIONS lists your tokens. Switch between Active and Closed at the top right of the table. The number next to the title counts the tokens in the list you're looking at. Click a token to open its page.
- Active: the tokens you still hold, with their Marketcap, Price, Volume (24h), Age, your Holdings (their value and the share of supply it represents), your PNL and their Launchpad. Your biggest position comes first.
- Closed: the tokens you no longer hold, with their Peak MC, Total Volume, Age, your PNL and their Launchpad. Your best PNL comes first.
